
Why the "dietary environment" influences the score in employee satisfaction surveys

"Our ES survey scores are stalling, but I don't know what to improve"
For HR and general-affairs staff, raising employee satisfaction (ES) is always a headache-inducing theme. Improving pay or leave systems runs into budget and rule barriers and doesn't happen easily. But in fact, there's an unexpected breakthrough.
It's the "dietary environment."
Multiple survey data show that how substantial the dietary environment is strongly influences the overall score of an ES survey. And this area, notably, can be improved at relatively low cost.
This article explains the mechanism by which the dietary environment sways ES survey scores and introduces concrete improvement measures.
- The Scale of the Dietary Environment's Impact on ES Survey Scores
- Data Showing the Relationship Between Meal Satisfaction and Turnover
- Improvement Measures for the Dietary Environment That Directly Raise Scores
- A guideline for introduction cost and cost-effectiveness
- Concrete Examples of Companies That Succeeded in Improving the Dietary Environment
TOC
The Positioning of "Dietary Environment" in ES Surveys
Questions About Meals Are Increasing in ES Surveys
In ES surveys of 2025–2026, meal-specific questions are increasing, such as "Are you satisfied with your workplace dietary environment?" and "Do you use the meal-related benefits the company provides?"
Behind this is the spread of health management. In the Certified Health & Productivity Management Outstanding Organizations program promoted by the Ministry of Economy, Trade and Industry, improving employees' food environment is included as an evaluation item. Following this trend, meal-related questions have come to be standard equipment in ES survey templates too.
The Mechanism by Which Meal Satisfaction Lifts the Overall ES Score
You might think "over just meals?", but looking at the data changes the impression.
According to a survey by a certain HR consulting firm, employees who answered "satisfied" with the dietary environment tended to give high scores on overall company satisfaction as well, showing a very high correlation coefficient of 0.72.
This is because the dietary environment serves as a barometer of "whether the company values its employees." Since meals are a daily thing, when this area is substantial, the sense that "this company thinks about me" accumulates day by day.
| ES survey item | Correlation with meal satisfaction | Ease of improvement |
|---|---|---|
| Sense of belonging to the company | High (0.72) | Moderate |
| Satisfaction with the workplace environment | High (0.68) | High |
| Evaluation of benefits | Very high (0.81) | High |
| Trust in one's supervisor | Low (0.23) | Low |
| Satisfaction with pay | Moderate (0.41) | Low |
What we'd like you to note is the "ease of improvement" column. Changing pay or the quality of supervisors is hard, but the dietary environment can be improved relatively easily. In other words, the improvement point with the highest cost performance is the dietary environment.
Meal Problems as "Invisible Dissatisfaction"
Dissatisfaction with the dietary environment is the kind of thing employees find hard to voice directly. "I want a raise" is easy to say, but "I'm troubled that there are few lunch options" isn't something people go out of their way to raise.
However, in the anonymous responses of an ES survey, such dissatisfactions come to the surface. At one manufacturer, the most common comment in the ES survey's free-response section was "the cafeteria menu is uniform and dull." This was reportedly a surprising discovery for management.
The Little-Known Relationship Between the Dietary Environment and Turnover
The Correlation of "Meals × Turnover" Shown by Data
You rarely hear the reason for leaving "I'm quitting because the dietary environment is bad." But there's a confirmed statistical tendency: the lower the satisfaction with the dietary environment, the higher the turnover rate.
A survey of 200 mid-sized domestic companies produced results like the following.
| Dietary-environment satisfaction | Average turnover rate | Features |
|---|---|---|
| High (80 points or more) | 8.2% | Substantial cafeteria, snacks, and meal subsidies |
| Moderate (50–79 points) | 12.7% | Some measures, but insufficient |
| Low (49 points or less) | 18.4% | Almost no meal-related benefits |
The turnover-rate gap is about 10 points. Of course the dietary environment isn't the only cause, but even after controlling for other conditions, meal satisfaction had a significant effect on turnover.
The Mechanism by Which Meal Dissatisfaction Leads to Turnover
Why does dissatisfaction with the dietary environment connect to turnover? The mechanism can be organized as follows.
1. Small Daily Stresses Accumulate
Small dissatisfactions—"no lunch options again today," "another cold convenience-store bento"—repeat about 240 times a year. This buildup connects to the feeling that "maybe it's tough to keep working here."
2. Easy to Compare with a Prospective Employer
"That company apparently has a great cafeteria." "My friend's company gives out free snacks." Because the dietary environment is concrete and easy to compare, it tends to become a trigger for considering a job change.
3. Declining Sense of Belonging
When the dietary environment is poor, the perception that "this company doesn't value its employees" is born. This leads to a declining sense of belonging and ultimately becomes the trigger for leaving.
Younger Employees Value the Dietary Environment More
Millennial and Gen Z employees are known to be highly sensitive to workplace comfort. Regarding the dietary environment in particular, they tend to view it as "part of well-being," and a growing number of students check for a cafeteria or snack corner during office tours in job hunting.
In a survey of employees in their 20s, 47% answered that they "consider the dietary environment when choosing a prospective employer." For companies feeling challenged in hiring and retaining young talent, reviewing the dietary environment may be an effective move.
Concrete Measures for Improving the Dietary Environment That Raise ES Scores
Measure 1: Diversifying the Cafeteria Menu and Improving Nutrition
Companies with a cafeteria should start by reviewing the menu.
| Points for improvement | Concrete efforts | Expected effect |
|---|---|---|
| Increasing the number of menu items | Expand daily specials from 3 to 5 kinds | Improved satisfaction with choices |
| Displaying nutritional balance | Note calories, salt, and vegetable amounts | Improved satisfaction among the health-conscious |
| Introducing special menus | Weekly ethnic day, monthly regional-ingredient fair, etc. | Raised anticipation for the cafeteria |
| Promoting vegetable intake | Set up a salad bar, add dried vegetables to miso soup | Improved vegetable intake |
Just adding dried vegetables to miso soup lets you easily increase the variety of vegetable items. Agriture's dried vegetables feature a lineup of distinctly Kyoto vegetables such as Kujo green onion, Kyo carrot, and Horikawa burdock, making it easy to add variety to a menu.
Measure 2: Introducing a Meal-Subsidy System
For companies without a cafeteria, or those whose work involves a lot of time out of the office, a meal-subsidy system is effective.
| System | Mechanism | Monthly cost (per person) |
|---|---|---|
| Ticket Restaurant | Charge an electronic card monthly, use at member stores | 3,500 yen |
| Bizmeshi | Free lunch at partner restaurants | Inquire |
| In-house bento delivery | Daily-changing delivery from a partner bento shop | 300–500 yen/meal |
| Snack service | Healthy snacks kept on hand in the office | 500–1,500 yen |
Ticket Restaurant can be expensed as a welfare/benefit cost if kept within 3,500 yen per person per month, offering a tax advantage too. Its appeal is that it enables a real improvement in conditions without reducing employees' take-home pay.
Measure 3: Improving the Office Food Environment
Improvements on the hardware side shouldn't be overlooked either. Preparing both the "place to eat" and the "things to eat" greatly changes satisfaction.
- Enriching the break space: Secure a bright, clean lunch space. Just placing window-side seats or greenery changes the impression
- Adding microwaves and refrigerators: For employees who bring bento, the microwave line is a source of stress
- Installing a water server: Surprisingly, one of the pieces of equipment that contributes most to satisfaction
- Healthy snack corner: Keep healthy snacks on hand, such as nuts, dried vegetables, and high-cacao chocolate
Measure 4: Running Food-Education Programs
Programs that provide knowledge about food aren't improvements to the dietary environment itself, but they also work positively on the "self-growth support" and "health support" items of an ES survey.
| Program | Frequency | Details | Implementation cost |
|---|---|---|---|
| Nutrition seminar | Once a month | A course by a registered dietitian | 30,000–100,000 yen/session |
| Cooking class | Once a quarter | A cooking event that doubles as team building | 50,000–150,000 yen/session |
| Meal-record challenge | For 3 months | Record meals via an app and support improvement | App usage fee only |
| In-house farm | Year-round | Raise interest in food through balcony gardening or herb-growing | Initial 30,000–50,000 yen |
Learn about Office Yaoya
We have prepared materials
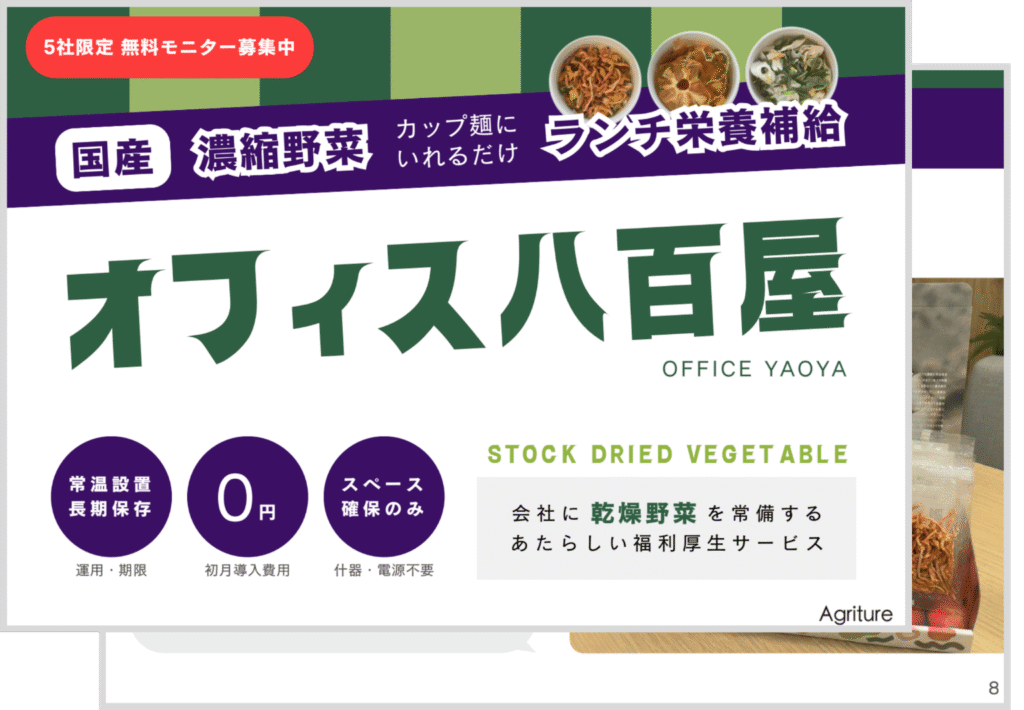
- Service details and vegetable lineup
- Pricing and plans
- How adoption and operation work

Sample sets are also available. Download the materials for details!
We offer sample sets so you can try Office Yaoya in small quantities. See the materials for details.
How to Measure the Effect of Improving the Dietary Environment in Numbers
Designing ES Survey Questions
To accurately measure the effect of improving the dietary environment, you need to build appropriate questions into the ES survey. A recommended question set is as follows.
| Question | Response format | What it measures |
|---|---|---|
| Are you satisfied with the workplace dietary environment? | 5-point scale | Overall satisfaction |
| Do you use the company's meal-related benefits? | Yes / No | Usage rate |
| Do you feel the dietary environment has improved? (after the measure) | 5-point scale | Sense of improvement |
| What would you like improved about the dietary environment? | Free response | Concrete needs |
| Is lunchtime fulfilling? | 5-point scale | Lunch satisfaction |
Setting a Baseline and Tracking the Course of Improvement
Before starting a measure, be sure to record the current score. This becomes your baseline.
After implementing the measure, tracking the course of meal satisfaction with a pulse survey (a simple check) every 3 months is effective. Even if the full ES survey is once or twice a year, a pulse survey of about 3 questions can be run monthly.
Visualizing the course of improvement and reporting it to management also leads to securing next year's budget. "After investing 50,000 yen a month in improving the dietary environment, the ES survey's meal satisfaction rose 22 points and turnover fell 3 points." If you can say this, the return on investment is clear, right?
Correlation Analysis with Other Indicators
To evaluate the effect of improving the dietary environment from multiple angles, we also recommend looking at correlations with the following indicators.
- Turnover rate: Whether turnover falls as meal satisfaction rises
- Absence rate: Whether improved eating affects health status
- Productivity indicators: Whether there's a change in afternoon work efficiency
- Number of job applications: The effect of highlighting "substantial dietary environment" on the recruiting page
Company Cases That Delivered Results by Improving the Dietary Environment
Case 1: A Consulting Firm That Raised ES Scores 18 Points by Introducing Meal Subsidies
A consulting firm with 120 employees introduced both Ticket Restaurant (3,500 yen/person/month) and office snacks (1,000 yen/person/month) at the same time.
Before introduction, "dietary environment" satisfaction in the ES survey was 42 points, but 6 months after introduction it rose to 60 points. The overall ES score also improved from 72 to 78 points.
Especially notable was the change in turnover. The annual turnover rate before introduction was 16%, but a year after introduction it fell to 11%. Converted to recruiting costs, this was estimated to have an annual reduction effect of about 8 million yen.
Case 2: A Manufacturer Whose New-Grad Applications Rose 1.5x After a Cafeteria Renewal
A manufacturer with 500 employees fully renewed its aging cafeteria. It set up menus using local ingredients and a dedicated corner for healthy menus.
When they publicized the renewal on their recruiting site and social media, the number of new-graduate applicants rose to 1.5 times the previous year. More than 30% of students reportedly answered in interviews that "the cafeteria was appealing."
The cafeteria also installed a soup bar using Kyoto-grown dried vegetables. Employees gave it high marks—"you can enjoy a different vegetable flavor every day"—and the ES survey's meal satisfaction rose 35 points.
Case 3: A Small Company That Improved Scores by Accumulating Low-Cost Measures
A web-marketing company with 25 employees introduced the following measures in phases, without a large budget available.
| Timing | Measure | Monthly cost | Effect |
|---|---|---|---|
| Month 1 | Install a water server | 4,000 yen | Meal satisfaction +5 points |
| Month 2 | Add a microwave (a second unit) | 0 yen (equipment purchase) | Meal satisfaction +3 points |
| Month 3 | Keep healthy snacks on hand (nuts, dried vegetables) | 8,000 yen | Meal satisfaction +8 points |
| Month 6 | A monthly team-lunch system | 15,000 yen | Meal satisfaction +6 points |
Over six months, meal satisfaction rose 22 points in total. The added monthly cost was about 27,000 yen, which per person comes to 1,080 yen a month. Honestly, getting this much effect for this cost is surprising, isn't it?
FAQ
Learn about Office Yaoya
We have prepared materials
- Service details and vegetable lineup
- Pricing and plans
- How adoption and operation work
Sample sets are also available. Download the materials for details!
We offer sample sets so you can try Office Yaoya in small quantities. See the materials for details.
Summary
The impact of the dietary-environment score on the whole in an employee satisfaction survey is greater than many companies imagine.
Companies with high meal satisfaction have low turnover and a strong sense of belonging. What's more, improving the dietary environment has an overwhelmingly lower bar than pay raises or system changes, and the cost can be kept down.
First, start by adding two meal-related questions to your current ES survey to grasp the current state. On that basis, accumulating small improvements—installing a water server, keeping snacks on hand—should let you feel a change in scores after half a year.
Investing in the dietary environment not only raises employee satisfaction but also leads to turnover prevention, stronger recruiting, and advancing health management. Put mildly, there's no reason not to do it.
Download the office dried vegetable materials
We will send the materials to your email address based on the information you provide.
Recommended reading
Sustainable initiatives / Commercial dried vegetables / Product lineup / [For Restaurants!] Use Dried Vegetables to Cut Food Waste and Improve Operational Efficiency at Your Store / What are the challenges of apple farming? A thorough explanation of the current state and solutions
- Office snack adoption guide | A comparison of pricing and selection across 8 stocking-service providers
- A Must-See for HR: 12 Measures to Raise Employee Satisfaction Through Benefits
Author of this article
Related articles
-
 [2026 edition] What is a meal subsidy as an employee benefit? A guide to adoption steps and a comparison of popular services
 -
[2026 edition] Meal-subsidy benefits usable at convenience stores | 3 ways to adopt them tax-free
-
[2026 edition] 6 disadvantages of placed staff meals and how to avoid them | An adoption checklist to avoid failure
-
 A Must-See for HR: 12 Measures to Raise Employee Satisfaction Through Benefits
 -
 Food Questions in the Health and Productivity Management Survey: What to Write to Score Points
 -
Summary of tax benefits for dining subsidies | Tax-exemption requirements and expense booking
-
Food Programs for Health and Productivity Management: How Much Will It Actually Cost for a Company Our Size?
-
Meal-benefit plans that even small offices of 10 or fewer people can start